Lately, I have been searching for a company which has good profit margins, a business model which is non-conventional (i.e., not manufacturing, banking, plantation, and trading in nature), and resilient to external market shocks. I hope I have found the right company! This week I will be looking at Cypark Resources Berhad (5184). Cypark is a company that is involved with the provision of environmental solutions. It has 4 main business segments which are: 1. Environmental engineering: Provision of nature conservation and environmental improvement services. 2. Landscaping and infrastructure: Provision of landscape services, project management services, and infrastructure development. 3. Maintenance: Provision of specialist maintenance works on leachate treatment plants, landscape services for parks, and maintenance of public amenities. 4. Green technology & renewable energy: Solar panel, biogas, biomass, waste-to-energy, and other renewable energy project
This week I wanted to take look at Century Logistics Holdings Bhd (7117) to see whether it has any potential investment value. I have never analysed this company in more detail as I had never allocated time to look at it; my loss though. Since rallying to a high of RM 1.40 in June 16, 2017, it retraced to RM 1.03 in September 2017. Ever since then, the company’s share price has been consolidating.
The company is involved with the logistics business, as described by its name – Century Logistics. This analysis is a litmus test to see whether this company warrants more attention. It was noted that on October 31, 2016, the founder and major shareholder, Datuk Richard Phua, had transacted to dispose off his 31.44% stake in Century Logistics to CJ Korea Express Asia Ltd for RM1.45 per share. Its new parent company CJ Logistics Corp is quite a large Korean logistics company with an annual turnover of over USD 4 billion.
Below is a chart of its share price performance for 1 year:
Chart 1: Century Logistics Holdings Bhd Share Price Chart

Below are the quarterly financial results of Century Logistics for the past 10 quarters. The purpose of the charts below are to determine whether were there any growth in the financial results of the company.
Chart 2: Quarterly Revenue Trend

Chart 3: Quarterly Profit after Tax Trend

Chart 4: Earnings per Share

Based on the graphical view of its profit after tax and earnings per share trend, there has not been much growth. Its share price rallied to a high of RM 1.40 in June 16, 2017. After reporting lower profits in August 2017, its share price retraced to about RM 1. 20 in November 2017. Technically, if there are no improvement in its financials, prices should continue to consolidate.
Technical Analysis Review of its price action

From the price chart, it is noted that price action is quite bearish. The candle on November 14, 2017 closed below its 20-day exponential moving average. It tested its recent high of RM1.18 three times in August, September, and October; prices subsequently failed to rally and close above this price level. The MACD histogram which indicates momentum shows a loss of bullish momentum in the stock; note the bearish crossover of the 9-day signal line on November 13.
Key support and resistance levels:
Support: RM 1.03, RM 0.97
Resistance: RM 1.18, RM 1.30
Conclusion
In my opinion, I would think that investors should look out for more positive news which will materialize into actual profits before committing to this company.
Market sentiment has been bearish lately, do check out my review of the FBMKLCI to get a feel of the market direction HERE.
If you like my posts and this blog please SUBSCRIBE in the link above or follow me on Google+ !!! THANKS
Note: This is not a recommendation to buy or sell this stock. The writer does not own shares in this company. The writer intends to share his view point on this stock’s potential investment value, any decision to invest or sell shares in this company is entirely at the reader’s own risk.
The company is involved with the logistics business, as described by its name – Century Logistics. This analysis is a litmus test to see whether this company warrants more attention. It was noted that on October 31, 2016, the founder and major shareholder, Datuk Richard Phua, had transacted to dispose off his 31.44% stake in Century Logistics to CJ Korea Express Asia Ltd for RM1.45 per share. Its new parent company CJ Logistics Corp is quite a large Korean logistics company with an annual turnover of over USD 4 billion.
Below is a chart of its share price performance for 1 year:
Chart 1: Century Logistics Holdings Bhd Share Price Chart

Below are the quarterly financial results of Century Logistics for the past 10 quarters. The purpose of the charts below are to determine whether were there any growth in the financial results of the company.
Chart 2: Quarterly Revenue Trend

Chart 3: Quarterly Profit after Tax Trend
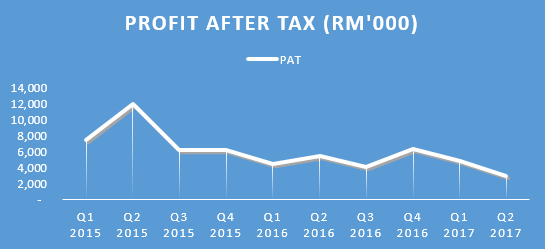
Chart 4: Earnings per Share

Based on the graphical view of its profit after tax and earnings per share trend, there has not been much growth. Its share price rallied to a high of RM 1.40 in June 16, 2017. After reporting lower profits in August 2017, its share price retraced to about RM 1. 20 in November 2017. Technically, if there are no improvement in its financials, prices should continue to consolidate.
Technical Analysis Review of its price action

From the price chart, it is noted that price action is quite bearish. The candle on November 14, 2017 closed below its 20-day exponential moving average. It tested its recent high of RM1.18 three times in August, September, and October; prices subsequently failed to rally and close above this price level. The MACD histogram which indicates momentum shows a loss of bullish momentum in the stock; note the bearish crossover of the 9-day signal line on November 13.
Key support and resistance levels:
Support: RM 1.03, RM 0.97
Resistance: RM 1.18, RM 1.30
Conclusion
In my opinion, I would think that investors should look out for more positive news which will materialize into actual profits before committing to this company.
Market sentiment has been bearish lately, do check out my review of the FBMKLCI to get a feel of the market direction HERE.
If you like my posts and this blog please SUBSCRIBE in the link above or follow me on Google+ !!! THANKS
Note: This is not a recommendation to buy or sell this stock. The writer does not own shares in this company. The writer intends to share his view point on this stock’s potential investment value, any decision to invest or sell shares in this company is entirely at the reader’s own risk.
Comments
Post a Comment